Last Updated on 10 February, 2024 by Trading System
There are many trading indicators that promise to help you find profitable trading opportunities. One well-known indicator is the ADX indicator.
ADX or Average Directional Index, is a trading indicator that measures the strength of market trends, regardless of them being positive or negative. Being one of the most common trading indicators introduced many years ago, it still remains one of the most useful and effective ones, still to this date!
In this guide to the Average Directional Index, you’re going to learn:
- How ADX Works
- How To Read the ADX line, -DI, and +DI.
- How to find the best ADX settings
- Three Trading Strategies
- How to use ADX in both mean reversion AND trend following
Let’s begin!
How Does ADX Work?
ADX, which stands for Average Directional Index, is a trading indicator that’s used to measure the overall strength of trends in the market. It’s often used as a filter to enhance an existing trading strategy, by removing a lot of unwanted and losing trades.
ADX doesn’t show the direction of the trend, but only the trend strength.
The general interpretation is that ADX values above 25 signal a strong trend, while readings below 15 suggest a calm market that’s not trending at the moment. Then, depending on the ADX level, we may decide to employ mean reversion or trend following strategies. For example, we might want to go long on a new breakout only if ADX is showing high readings, which signals that the trend is strong and healthy.
Now, what’s considered a high or low reading varies a lot depending on the length of the ADX. As you’ll learn later, ADX readings may very well go as high as 70 or 80, if you use a length setting that’s short enough. However, with the 14-period ADX, which is the default length, the threshold values just presented (below 15 for calm markets and above 25 for trending markets) tend to work quite well!
History of ADX – How Did it Come About
The first appearance of the ADX indicator was in Wilder’s book “New Concepts In Technical Trading Systems”, released in 1978. In the same book, Wilder presented a couple of other trading indicators that still remain relevant to this day. The Average True Range (ATR) indicator, and Parabolic SAR are two well-known examples.
What’s fascinating about the book is that they were written before the computer age, where many calculations still were made by hand. Still, the book outlines detailed instructions on how the ADX is calculated, which would take a substantial amount of time to be performed by hand.
Reading the ADX Line
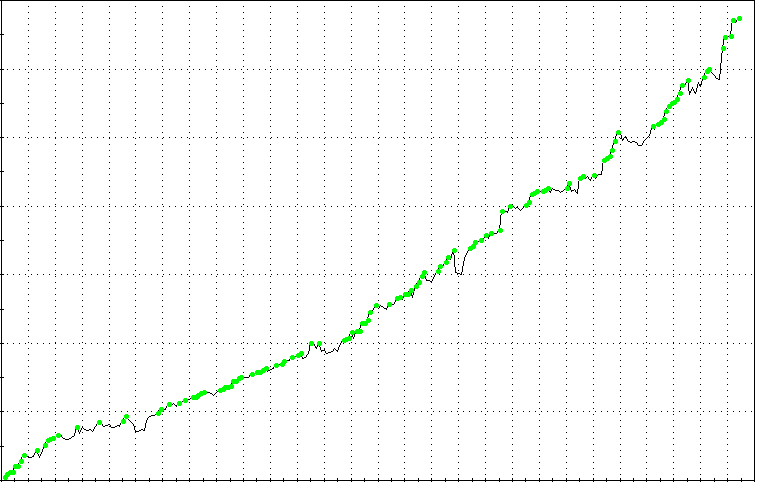
A typical ADX graph often will look something like this:

The black line marked with an arrow shows the ADX line. This is the line that you will use to determine the trend strength, and its reading is not affected by the direction of the trend. As you see, the ADX line goes back and forth, as the trend strength of the market changes.
In the image below, a high ADX reading is highlighted with a circle. Notice how the ADX reading went up together with the increase in market trend strength, coming from a low volatility environment.

Having covered the ADX line, let’s now go on to the green and red lines on the two charts above!
(+DI/-DI ) The Negative and Positive Directional Index
When using ADX, you’ll often stumble upon the positive and negative directional indicators:
The positive directional index(DI+) shows the strength of positive price moves. When it’s sloping upwards, it’s a sign that the uptrend is getting stronger.
The negative directional index(DI-) shows the strength of positive price moves. When it’s sloping downwards, it’s a sign the downtrend is getting weaker.
The ADX reading is an average of the absolute difference between these two values, which is the reason why it only shows the strength of the trend, and not its direction.
Examples of +DI and -DI)
The positive and negative directional indexes sometimes are built into the ADX indicator, like below:

In the image above, the following applies:
The green line is the positive directional indicator line (DI+)
The red line is the negative directional indicator(DI-).
The black line is the ADX.
If the red line(-DI) is higher than the green line(+DI) that is generally an indication of a bearish trend. Conversely, if the green line(+DI) is higher than the red line(-DI) that is generally an indication of a bullish trend.
One can say that these bi-directional lines are like two strong animals (a bull and a bear) pulling the market in both directions. Sometimes the up-trend is stronger than the downtrend. In the above diagram, the uptrend overpowers the downtrend when the green line is above the red line. When this happens, a bullish phase is indicated.
Later in the article, we’ll cover in better detail the different ways that traders use to employ ADX!
ADX Calculation

The formula for calculating ADX may be hard to grasp at first, and is something you could skip if you only want to know how to use the indicator.
However, if you’re interested in getting to know ADX from the ground up, here it is:
Step 1: Calculate the plus and Minus Directional Movement (+DM/-DM)
The calculation of ADX begins with determining the plus and minus directional movement, which is also called DM.
The directional movement readings are calculated in the following way:
The Plus Directional movement(+DM) is equal to the current high minus the previous high, only if it’s greater than zero and bigger than -DM. Otherwise, it’s set to zero.
The Negative Directional Movement (-DM), is equal to the current low minus the previous low, if it’s bigger than +DM and greater than zero. Otherwise, it’s zero.
Step 2: Calculate the Positive and Negative Directional Indicators (+DI/-Di)
The positive directional indicator which is abbreviated +DI is equal to the Exponential moving average of +DM, times 100, divided by the average true range for the given time period, which usually is 14.
The negative directional indicator, abbreviated -DI, is equal to the Exponential moving average of -DM, times 100, once again divided by the average true range for the given time period, which typically is 14.
Step 3: Calculate ADX
In the final step, you take the exponential moving average of the absolute difference of (+DI minus -DI) divided by (+DI plus -DI)
As you see, calculating ADX involves quite a lot of steps. We are lucky to have the computers taking care of this for us!
Our Experiences With ADX
In our own testing we’ve found that ADX is one of the most versatile and useful indicators there is. This is not that strange, considering that volatility, which ADX to some extent measures, is inherent in everything that moves. Together with the fact that the performance of many trading strategies is heavily impacted by volatility and trend strength, ADX becomes a powerful tool to improve and build trading strategies!
A lot of our trading strategies use ADX, and while you may use the default 14-periods, you definitely should try some other values as well. Most of the time we find that the 14-period IS NOT optimal and decide to go with settings as low as 3 up to perhaps 30 at the most.
We’ll cover how we choose the best ADX settings for our trading strategies later, under “The Best Settings, Timeframes, and Levels for ADX”.
Strong and Weak ADX Readings
When traders use ADX, they tend to have some quite specific levels in mind, which they believe signal different things about the market.
For instance, as we covered earlier, readings above 25 are considered a sign of a strong trend, while readings below 15 signal the opposite. Of course, a market could be more or less trending, which means that the following might be a more accurate description:
10-15 Calm
15-20: Starting to trend or Calm
20-25: Trending
25-35: Quite a strong trend
35-50: Very Strong trend.
While the ranges above act as good guidelines, we may benefit from having a look at some real examples, to better understand how ADX readings mirror the strength of a market trend!
However, remember that there are many approaches to reading ADX levels and that every trader may have his or her own thresholds to act by!
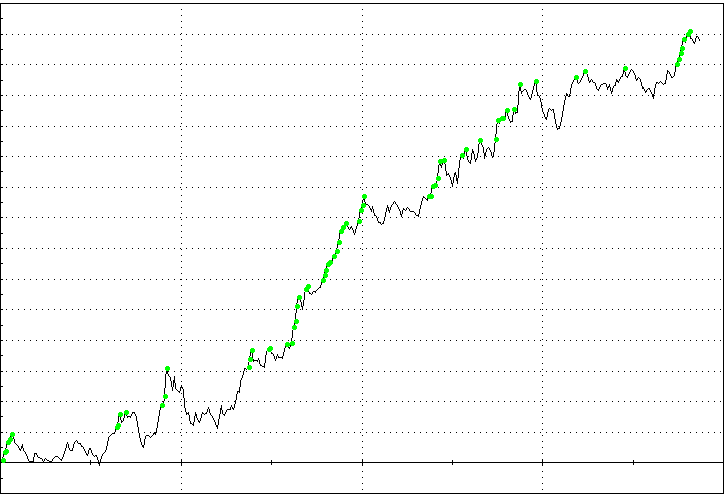
ADX Between 5 to 15

Starting off with readings between 5-15, we clearly see in the image above how low ADX readings indicate a market that lacks a real trend and that instead goes sideways. While these market conditions may not be that well suited for trend following, we’ll soon see how they may work better with mean reversion!
ADX Between 15 to 20

Even though the market is quite calm with only slightly higher ADX readings, we clearly see how ADX readings between 15 to 20 indicate that the market is trending somewhat.
ADX Between 20 to 25
This is when we start to see some real trends with a noticeable slope setting in!

Even though the differences between this and the previous image aren’t that significant, they are big enough.
ADX Between 25 to 35

Now we’re starting to see some quite strong impulses, which in the case above in fact lead to a reversal of the trend.
This is a tendency that can be observed in quite many situations, where high ADX readings may actually pave the way for a counter-reaction. We’ll take a closer look at this in just a bit!
ADX Reading Between 35-50

Now we’re getting to the extreme readings, which aren’t spotted that often. In fact, to find an occasion where the S&P-500 managed to get up towards fifty more than just one time, we had to go all the way back to the financial crisis of 2008!
Of course, in other more volatile securities, you will find that high readings like these occur more often. In those situations it may also be appropriate to adjust your expectations a little, to account for the behavior of the market you’re working with. This is also something that will be covered in more detail, in just a bit!
What Do Strong and Weak Readings ACTUALLY Tell Us?
The approach that’s probably the most common, is to use ADX as a tool to know when a trend is worth riding along. The traditional interpretation is that high ADX readings ensure that it’s likely for the market to continue in the direction of the prevailing trend.
Now, we’re not saying that this isn’t the case, because it will be, in some cases. However, on the contrary, it may be that a high ADX reading instead signals that a market is depleted of its strength, and soon will move in the opposite direction.
To better understand how ADX can be used in both these scenarios, we need to know the concepts of trend following and mean reversion. Let’s just have a quick look at both!
Mean Reversion
Mean Reversion refers to the tendency of a market to revert to its mean after having performed too big moves in either direction. This is a tendency that’s especially common in stocks and equities. Below is an illustration of the price swinging around its mean.

As is visible above, we say that a market is oversold once it has moved too much to the downside, and overbought when it has gone up too much.
Trend Following

Trend following is based on the very opposite approach, where big market moves in one direction are taken as a signal that the market will continue in that direction, rather than that it’s about to turn around.
Trend following usefully work quite well on commodities.
How Can ADX Help in Both These Scenarios?
Since ADX measures something as universal as trend strength and momentum, it can often be successfully applied to both mean reversion and trend following strategies!
In Mean Reversion Strategies
In mean reversion strategies, a high ADX-reading may be used to enhance oversold signals in other indicators or conditions, since it indicates that the move leading down was a firm one. And as is often the case in mean reversion, sudden and prolonged moves in one direction tend to result in a market reversal.
In the image below, you see how a high ADX reading, coupled with oversold RSI readings, preceded a market reversal.

In Trend Following
When it comes to trend following strategies, most people assume that a high ADX reading will help a great deal with filtering out false signals. The belief goes that a market that’s firm and decisive, will have a greater chance of continuing in the current direction.
While this may hold true in some cases, the opposite could hold true as well. For example, sometimes a high ADX reading could be a sign that a market has been depleted of its current trend strength, and soon is about to turn around. In other words, some trend-following or breakout strategies may have a lot in common with mean reversion trading strategies when coupled with high ADX readings.
However, keep in mind that different strategies may react very differently to high or low ADX readings. With high ADX-readings, some may react as described above, while others instead will benefit immensely. It all depends on the strategy, timeframe, and market.
This is the reason why we always recommend that you use backtesting to see what works in the real world. Way too many traders base their decisions on beliefs of how the market should perform. However, most times markets don’t behave as we expect them to, which inevitably will cause issues for those who rely solely on their gut feeling!
The Best Settings, Timeframes, and Levels for ADX

Many traders want to know the best settings for their particular indicator. However, the harsh truth is that the best settings for any indicator will vary greatly depending on the market, timeframe, and strategy traded.
However, what we can tell you, is that you definitely should try to experiment with different ADX readings and threshold levels. If you were to take a look at the trading strategies we trade at the moment, you would notice that we use a wide range of ADX settings. Here follow the four length settings we use the most.
5 – period ADX: Having a much shorter length than the default 14-periods, lets us catch the short terms momentum in the market. This has proven to be useful numerous times, when the longer, 14-period setting simply is too slow to react to recent changes in the market.
Using 5-bars for the length with daily bars also makes sense, considering that one trading week is five bars. This way you may have better luck in quantifying momentum that’s pertinent only to the last week!
10 – Period ADX: This setting is somewhere in between the 5-period and default 14-period length, and could yield some quite interesting results. In some cases, we’ve found that 2 weeks (10 daily bars) is just the right length to define trend strength and momentum that has a significant effect on our trading strategy!
20 – period ADX: Now we’re going beyond the default 14-periods, and get a better picture of the longer-term trends and momentum. Also, with 20-periods being around one trading month when used with daily bars, you could definitely get some interesting results here! That’s also what we’ve seen in some of our trading strategies, where we really get much better results using a longer period.
40-period RSI: While we rarely use lengths that are this long for our own strategies, you may be helped with an even longer length than the 20-periods. It’s definitely worth a try!
Adjusting the Threshold Values
Earlier in the article, we provided some guidelines for how you could classify a market as trending or nontrending, depending on the ADX-reading. For example, we told you that ADX readings above 25 tells us that there is a strong trend.
Now, as you increase the length of the ADX, you’ll start to notice how it becomes less responsive and less likely to go into the really high readings.
The reason simply is that a longer length means that more values are included in the calculation. And since a market is unlikely to stay at extreme readings for very long, the result when accounting for all the values during the period won’t be that high.
This is also why you need to adjust the threshold values as you adjust the ADX length. For instance, a 5-period ADX will reach high readings much more frequently than a 20-period ADX.
To demonstrate this, I’ve applied three ADX indicators to a chart. The ADX at the top uses has a length of 5, the middle a length of 10, and the one at the bottom a length of 20.

On the last bar of the chart, these are the ADX values we get:
5- period ADX: 42
10-period ADX: 38
20-period ADX: 25
As you see, these quite a big difference between the three. And in some cases, it might be even bigger. For instance, it’s not uncommon to see that the 10-period ADX only outputs half the reading of the 5-period ADX.
Following this, it’s quite apparent that the shorter length you use, the higher the thresholds you need to set!
ADX Trading Strategies
There are many trading strategies that use the ADX, either as the main entry trigger, or just as a filter.
In this section of the guide, we’ll cover some of the most popular and common ADX trading strategies.
As always, it’s paramount that you do your own testing and validation before trading any strategy or edge. The strategies below should primarily be seen as a source of inspiration, but still are a great way to get started in the markets.
Let’s begin!
DMI Crossover Strategy
Since the ADX line itself doesn’t provide any clues whatsoever about the current direction of the market, it’s quite common to make use of the DI plus and DI minus to know when it’s time to enter a trade.
The DMI crossover strategy also takes this approach and uses a crossover of the DI+ above the DI- to go long, and the opposite condition to go short. In essence, this means that you’re trying to pick times when the direction of the momentum shifts, in hopes of riding the new trend.
In addition to the DI-crossover rule, ADX-14 must be higher than 25, signaling that there is enough momentum to make the market continue in the direction of the momentum.
Below you see an example of a DMI crossover where both these conditions are met:

In summary, these are the conditions for the DMI crossover strategy:
- ADX must show a reading of 25 or more
- If the +DI crosses over the -DI, go long.
- If the +DI crosses below -DI, exit the position.
ADX Breakouts
When we look for high ADX readings, we generally use static values to determine whether a reading is high or low. However, another approach that could be quite effective, would be to look for ADX highs relative to the current ADX reading, to see which one is bigger. That way we adopt an adaptive approach that takes into account the recent performance of the market.
To make a trading strategy out of this adaptive approach, we’ll also use the DMI plus and DMI minus, as in the earlier example. We’ll require that DMIplus is higher than DMIminus, to ensure that we have a positive trend. As such, the conditions to enter the market become:
- ADX is at a 20 bar high.
- DI+is higher than DI+
Below is an example where the conditions above were met:

Then, to exit the trade, you may wait until DI+ crosses below DI-
ADX with RSI
As we mentioned earlier in the article, ADX can be used not only in trend following strategies but also in mean reversion, to define oversold conditions that are worth acting on. In those cases, the role of the ADX shifts from a being a tool that tells us when market strength is worth acting on, to one that shows when it has moved too far in one direction.
Now, in this strategy, ADX will act as a filter for another entry condition to improve its accuracy and ensure that we have the odds in our favor.
The other condition will be that the 5-period RSI is below 20, which signals that the market has become oversold, and is due for a short term pullback.
If you’re not familiar with the RSI indicator, we recommend that you have a look at our complete guide to the RSI Indicator.
Below you see a chart where both these conditions are met.

To exit the trade, you have a range of options. Here are three common approaches:
Time exit: Wait a certain number of bars to close the position
RSI Exit: You may wait for the RSI to cross above 50, signaling that the reversion we waited for has occurred.
End of day exit: If you’re trading intraday, you may just close the position by the end of the day. Although being simple, it tends to be an effective approach!
Disadvantages of ADX
While ADX is a great tool that can help you tremendously, it does have some disadvantages, like any other indicator or tool in technical analysis. Here are our two main points:
- ADX is a lagging indicator, which means that it reacts first when a trend has been initiated. In that regard, it may not be an effective tool when it comes to spotting early emerging trends.
- Although it may be regarded as a feature, ADX doesn’t give clues about the direction of the trend, but requires us to resort to comparing the DI values to each other.
These are just minor points, and all in all, ADX is an excellent trading indicator that we value a lot, and believe you will too!
Conclusion
Used to measure the strength of a trend, ADX is one of the most versatile trading indicators out there. Being so, it can be used not only for trend following strategies, but for nearly any type of strategy that operates in a market where volatility, as well as the direction of the trend, is shifting.
However, remember to experiment with the length and threshold values. We seldom find that the default settings work the best, and have used a wide range of settings in the past, in accordance with the market, strategy, and timeframe we’ve been trading.
FAQ
How do you interpret ADX readings?
ADX, or Average Directional Index, is a trading indicator that measures the strength of market trends, regardless of their direction. It does not indicate the trend’s direction but rather focuses on trend strength. ADX values above 25 suggest a strong trend, while readings below 15 indicate a calm market. Different ranges may signify varying levels of trend strength.
What does a high ADX reading indicate, and how is it beneficial in trading?
A high ADX reading suggests a strong trend, making it valuable for trend-following strategies. Traders often use ADX to filter out false signals and enhance the effectiveness of their trading strategies.
What are some recommended ADX settings for trading strategies?
The optimal ADX settings depend on the market, timeframe, and strategy. Commonly used settings include 5, 10, 20, and 40-period ADX lengths. Traders are encouraged to experiment with different settings to find what works best for their specific context.