Last Updated on 15 January, 2025 by Trading System
The Original Donchian Channel Trading Strategies is a technical trading indicator invented by Richard Donchian, mainly for trend-following purposes. The Donchian channel indicator plots an upper band, which is the n-bar high, a lower band which is the n-bar low, and a middle band that’s the average of the two. The preferred and best Donchian channel setting according to many traders is 20. Many traders regard a breakout above the upper band or below the lower band as a signal worth acting on.
In this complete guide to Donchian channels, you’ll learn everything you need to know about the indicator.
We have a lot to go through, so let’s begin!
History of the original Donchian Channels – Richard Donchian

Before covering how you could use Donchian channels in your trading, we thought that it would be interesting to know a little about its creator, Richard Donchian.
Richard Donchian was born in 1905 in Connecticut and was a commodities and futures trader. He pioneered in the managed futures field, and is by many considered the founder of the managed futures industry.
Richard’s parents were immigrants from Armenia, who came to the United States just some 20 years before his birth. To provide for themselves, they ran an oriental rug store, and Richard was presumed to help run the family’s business. Despite this, Richard graduated from Yale University with a Bachelors’s Degree in Economics, later receiving an MBA from MIT Sloan School of Management. However, he didn’t escape the family’s business and started working there as an assistant right after getting his degree.
This was also the time when Richard Donchian started to grow an interest in the stock market. Upon discovering the fictionalized biography of Jesse Livermore, “Reminiscences of a stock operator”, he decided to give the financial markets a try. As the market crash of 1929 made him incur some losses, it sparked a new interest in technical analysis as a way of analyzing the price of a market.
In the beginning of the 1930s, he became the publisher of a popular stock market service named security pilot. Soon he landed a job as a securities analyst, and account executive.
After his service in the military, Richard Donchian started to work on what would eventually become the Donchial Channels. He changed his focus to the development of the rule-based trading strategies and systems that would soon become his trend-following approach.
In fact, Richard Donchian is considered the father of trend following, and as we’ll see soon, the Donchian Channels indicator reflects this.
Two interesting facts about Richard Donchian:
- Although picking up an interest in the stock market at a relatively young age, Richard didn’t make that much money at the beginning.
- Richard was interested in finding a more conservative method for trading the futures and equity markets, where low volatility stocks were especially interesting to him.
How Are Donchian Channels Calculated?
Together with other price channel indicators, like Bollinger bands and Keltner Channels, the Donchian Channels indicator remains one of the most popular trading indicators. Despite this, it is calculated in a very simple, yet effective way.
Donchian Channels consist of three bands, which are shown in the chart below. The two outer simply mark the highest high and the lowest low for the period, with the middle being an average of the two.
So:
Upper band: the highest high for the last n-periods.
Middle band: the average of the upper and lower line
Lower band: the lowest low for the last n-periods

You may choose yourself what settings to use, but you should be aware that the best settings vary a lot depending on the timeframe and market that’s used.
However, the default setting is 20 periods and this is what most investors and traders have come to use.
Still, you should definitely try some other settings. We seldom use the default periods, since other settings often will yield better results.
Later in the article, we’ll discuss how you may go about to pick the best settings!
How Do You Use Donchian Channels in Trading?
Depending on your trading approach, Donchian channels can be used in a wide variety. We ourselves have been helped a lot by this indicator, and have many strategies that use it to filter out bad trades, or that rely on it completely for the entry trigger.
However, before covering the main two approaches that are used with Donchian channels, we’ll take a closer look at how we may use the indicator to gauge the volatility level of a market!
Here you can read more about Donchian Channel Trading Strategy.
Determining Volatility with the Distance between the Bands
As the upper and lower bands note the highest high and lowest low for the chosen period, the distance between the two naturally becomes a measure of the current volatility levels in a market.
This can be of great help when you want to define low and high volatility conditions for a trading strategy. You may also use it in conjunction with some of the Donchian channels applications we’ll cover later in the article.
To make it clearer, we’ve taken a 15-min chart of the gold futures market where we see how the distance between the bands gives a clear indication of the current volatility level of the market.

As you see, the rise in prices in the middle of the chart makes the distance between the bands go up significantly compared to the period just before the positive breakout.
In fact, the scenario above is a quite common one, that’s watched by many traders and investors. When the distance between the bands gets smaller and smaller, it’s generally believed that the chances of a powerful breakout to either side get bigger.
Having covered this concept of measuring volatility with the Donchian channels, we’ll now have a closer look at mean reversion and trend following, which are the two main trading approaches that you may use with the Donchian channels.
Let’s explore them!
Trend Following
As you may know, trend following is the concept of trying to capitalize on the momentum of a market by entering in the direction of the trend. We simply assume that a market that has momentum is likely to continue in that direction.
As you may remember, this was also Richard Donchian’s own trading style, and what he created Donchian channels for. Thus, using the indicator in conjunction with a trend following trading methodology is what the indicator was meant for in the first place, and what many traders still use it for.
So, how do you define an entry signal?
Well, the most common approach is to regard a breakout above the upper band as a positive signal, and a breakout below the lower band as a signal to go short. Like below:

When reading the chart above, keep in mind that the price will never be above or below the Donchian channel bands, since they will automatically be placed at the highest and lowest price. Therefore a small bump to the upside for the upper band shows that we’ve got a new highest high, and vice versa.
How to Take Profit in Breakout Trades
There are several ways that you can go about exiting a trade following a breakout trade. Here follow three of the most commonly used approaches:
Trailing stops – Some traders will insist that the best way to catch the trend that follows a breakout, is to use a trailing stop that trails the price. This way you attempt to milk the trend for as long as possible and try to catch the bigger moves of the market.
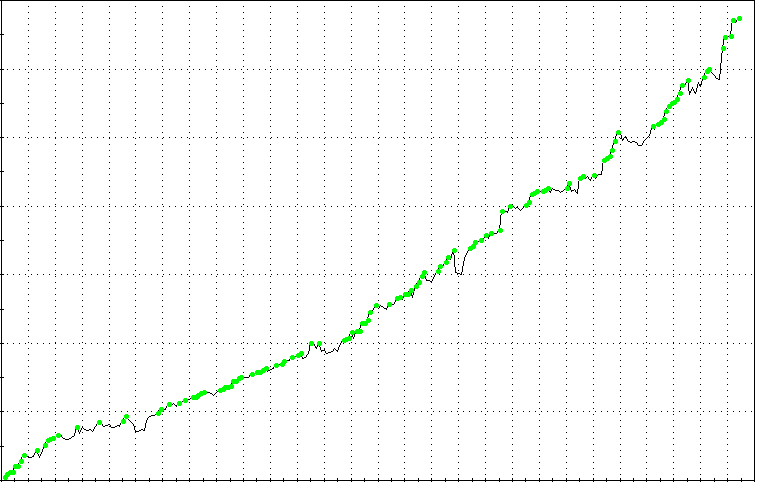
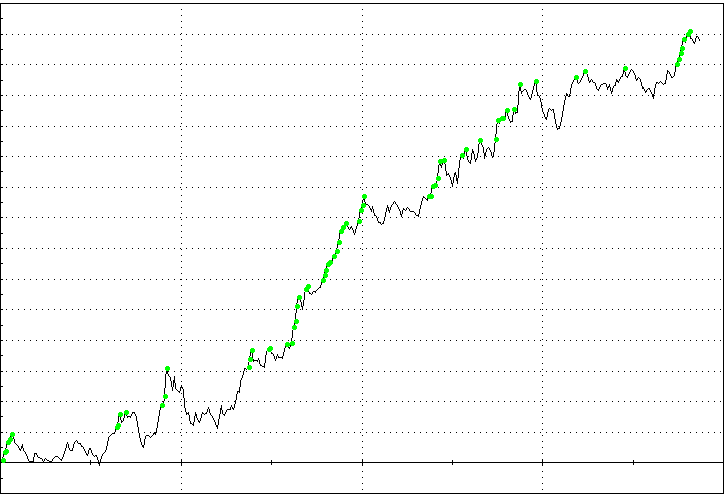
In the image below you see how a breakout above the upper band marked the start of a trend that persisted for quite some time. And with the help of a trailing stop consisting of a moving average, we managed to stay in the trend until its end.

In our guide to trailing stops, we cover this exit method in greater depth.
Time Exit- You may also use a simple time exit that will get you out of the market after a specific number of bars. While being an incredibly simple exit, this is something that works extremely well in some cases.
We recommend that you try to get an idea about the average duration of a trend in your market, and then use that measure to find out when it usually is time to get out of a trade. It doesn’t need to be very exact, the important thing is that you have some estimation of how long a trend tends to persist in your market!
Stop Loss and Profit Target- This is another common approach that you may use, and simply means that you place a stop loss and a profit target. Then your exit will be determined by which one of the two levels that’s hit first.
What’s important to keep in mind here, is that you should strive to have a risk-reward ratio of more than 1. This means that the potential profit of trade is bigger than the potential loss.
For instance, a trade where the profit target is placed $200 dollars away from the entry, with the stop loss placed $100 below the entry, would have a risk-reward ratio of 2.
However, if you’re risking $500 dollars only for a $100 reward, you have a risk-reward-ratio of only 0.2, which is way too small for most strategies.
Is Trend Following with Orignal Donchian Channels Tradable?
Well, in some commodity markets like energies that trend a lot, a system like the one presented above would probably make money in the long run. Still, this is by no means a good system and should be used together with other filters and conditions to improve the odds of a successful breakout.
However, in other markets like stocks and equities, you might want to look into using Donchian channels for mean reversion instead!
Mean Reversion
Mean reversion is the tendency of some markets to revert as they have made exaggerated moves in one direction. This is a tendency that’s especially pronounced in stocks and equities but can be found in other markets as well. When the market has moved too much to the downside it’s considered oversold. On the other hand, when it has moved too much to the upside, it’s considered overbought.
When using Donchian channels in mean reversion, we simply use the opposite rules to those used in trend following. That is, we regard a breakout above the previous highest high as a signal to go short, and a breakout below the lowest low as a signal to go long.
In the image below we go long when there is a new 20-bar low, and exit once the market crosses above the middle band. This is a quite common approach that many traders use in one form or another.

Now you may wonder how come that these rules work too when the inverse was outlined as profitable earlier in the article.
Well, it all depends on the market, timeframe, and strategy you trade. In some markets, you may want to use the mean-reverting approach, while others will work only with the trend following approach!
How to exit a Mean Reversion Trade With Donchian Channels
Exiting a mean reversion trade is a little different from exiting a trend following strategy.
Generally, with mean reversion strategies, the edge gets bigger the more the market goes against you. Due to that reason, you really don’t want to cut your losses too early. To be frank, the odds of a reversal are much higher when the trade has moved against you.
Still, we advise that you use a stop loss. Just make sure to keep it at a far distance. Otherwise, you’ll be stopped out too often, which will severely limit the profitability of your trading strategy.
Now, as to the profit-taking mechanism, we suggest that you use some condition that defines that the market isn’t oversold anymore. This could be defined as a close above the middle band, as we mentioned earlier, or with the help of momentum indicators, like the Relative Strength Index (RSI).
One of our favorite ways to exit mean reversion trades, simply is to wait until the short term RSI crosses above a high threshold value. This is something that has worked well over the years, and that we believe you’ll get a lot of use from too! Our guide to the RSI indicator covers exits like these in greater detail!
")
Note the Direction of the Trend!
When taking mean reversion trades with Donchian channels, it’s always a good idea to watch the overall direction of the trend.
The reason is quite simple.
A market in a falling trend will be more prone to continue making new lows, than a market in a rising trend.
This has the implication that a new 20-period low in a bullish market will be more likely to lead to reversal, than one that forms in a negative trend.
This is why we recommend that you use the 200-period moving average as a regime filter, to identify the long-term market trend. Then you may only take mean reversion trades if the market trades above its moving average.

Best Settings for Donchian Channels
The preferred Donchian channel setting according to many traders is 20.
If you think about it, this actually makes sense, since one trading month is just a little more than that.
However, this doesn’t mean that you should stick with the default setting.
On the contrary, we always recommend that you should experiment to see what settings work best in your market and timeframe.
We’d love to be able to say that a certain setting tends to work best, but that’s simply not possible. Every market has its own personality and will respond differently to varying indicator settings. As such, you’ll always have to test it yourself to see how your market, timeframe, and strategy respond to different settings.
This is best done with backtesting, meaning that you use software to simulate historical performance. We really recommend that you have a look at our guide to building a trading strategy or our complete guide to backtesting if you want to learn more about backtesting and how it’s used in trading!
Donchian Channels Trading Strategies
Having taken a closer look at how Donchian channels work, it’s now time to cover some trading strategies that are common among traders.
Now it’s extremely important that you always make sure to validate a strategy before trading it live. You never know exactly how your market and timeframe will react, and a trading strategy that works in one market may fall apart completely in another market!
Having said this, we really think that the strategies presented below serve great as inspirational sources! If you asked us how we would start to construct a trading strategy using Donchian channels, we certainly would try out a lot of the things below!
So, let’s now have a closer look at them!
Original Donchian Channels and MACD
In this strategy, we attempt to use the MACD indicator together with Original Donchian channels to find times when both give us a reason to believe that the market will go up or down.
More specifically, we’ll look to enter long trades on positive MACD crossovers appearing close to the lower band, and exit once we have a negative MACD crossover. This means that this strategy works with a mean reversion approach, where we try to profit from oversold conditions.
If you’re not familiar with the concept of MACD crossover, we highly recommend that you read our article on how to use the MACD indicator.
So, the rules for this strategy become that we enter trade if:
- The market is breaking out below the lower band or has recently performed a breakout.
- We have a positive MACD crossover, signaling that a trend reversal is likely.
To exit the trade we’ll wait until there is a negative MACD crossover, which signals that the move has come to an end. We’ll also exit if the market goes up and breaks the upper Donchian channel band.
Here you see an example of a trade. We bought on a MACD crossover when the market recently had broken down below the lower band. We then sold as soon as the upper band was taken out.

Donchian Channels and Doji
In this trading strategy, we’ll make use of the Doji, which is a candlestick pattern that usually signals uncertainty in the market. As such, it will help us to once again mark out entries when the market has moved too much to the downside and is likely to revert soon.

A Doji simply is a candle where the market closes and opens at roughly the same price.
So, the condition to buy will be that we have a breakout below the low that forms as a Doji, or is followed by a Doji. As in the previous strategy, we’ll exit the trade right when the market hits the upper band.
In the image below, you see an example of a Doji forming right after a breakout below the lower band.

Donchian Channels and ADX
Having just covered a mean reversion strategy, we’ll show you a strategy that profits from breakouts in a trend following fashion, as the indicator was meant to be used by its creator.
We’ll demand a breakout above the high of the upper band to go long, and a breakout below the lower band to go short.
However, as we’ve discussed earlier, entries like these are very likely to cause a lot of false breakouts, and in order to mitigate this, we’ll add a filter.
One method we like to use when filtering out bad trades is to employ the ADX indicator to know when there is enough momentum for a breakout to succeed.
We’ll demand an ADX reading that’s higher than 30 to go long. In theory, this ensures that the market is approaching and going beyond the upper band with such a force that it will continue in that direction.
For those who aren’t familiar with ADX, we cover the indicator and its uses in our complete guide to ADX
So, the rules become:
- There is a breakout above the upper band
- ADX is higher than 30
Then you may use a trailing stop, as described earlier in the article, to ride the trend for as long as possible

Donchian Channels VS Keltner Channels

There are a couple of more common price channel indicators, and one of those is the Keltner Channel.
The Keltner channel indicator consists of three lines as well, but is calculated in the following way:
- The middle band is an exponential moving average
- The upper and lower bands are placed at a distance equivalent to the average true range times two, above, and below the exponential moving average.
As you see, this is quite a difference from the Donchian channels which only rely on the highest high and lowest low for the period to plot the upper and lower band.
However, they may serve the same purpose in a trading strategy, although the results may vary quite a bit.
In our guide to Keltner Channels, you may learn more about the indicator!
Donchian Channels VS Bollinger Bands

Another type of price channel that’s more popular than Keltner channels, is the Bollinger bands indicator. In fact, it’s quite similar to Keltner Channels, but with one important difference.
As the Keltner Channels, Bollinger bands are based on an exponential moving average, which forms the middle band. However, the difference lies in the outer bands, which are placed a distance equivalent to 2 times the standard deviation of closing prices. This makes Bollinger bands show the dispersion from the mean or expected value, rather than actual market ranges.
When compared to the Donchian channel, you could say that the Bollinger bands are hit less often. Otherwise, you should be able to use them in a quite similar manner.
Our guide to Bollinger bands is a highly recommended read if you want to learn more about the indicator!
Ending Words
The Donchian channels indicator as created by Richard Donchian is one of those indicators that every trader should know of. Despite its simplicity, it can be of tremendous help both in trend following and mean reversion trading.
Just remember that there is no need to stick with the default settings. We seldom do this ourselves but use backtesting to determine what has worked best in the past!
Here are another good source with information about the Donchian Channels trading strategy.
FAQ
What Are the Best Settings for Donchian Channels, and Can They Be Customized?
While the default setting for Donchian Channels is 20 periods, the best settings can vary depending on the market and timeframe. Traders are encouraged to experiment with different settings through backtesting to find what works best for their specific context.
How Can Donchian Channels Help Determine Market Volatility?
The distance between the upper and lower bands of Donchian Channels can be used to gauge market volatility. A wider distance indicates higher volatility, while a narrower distance suggests lower volatility. This information is valuable for defining trading strategy conditions.
How Important is Backtesting in Validating Donchian Channel Trading Strategies?
Backtesting is crucial for validating the effectiveness of Donchian Channel trading strategies. It involves simulating historical performance to assess how the strategy would have performed in the past. This helps traders gain insights into potential risks and rewards before implementing strategies in live trading.