Last Updated on 10 February, 2024 by Trading System
Keltner Channels are a popular technical analysis tool used by traders to identify overbought and oversold market conditions, as well as to spot potential breakouts that could signal the start of a new trend. However, finding the optimal Keltner Channel parameters, or the best configuration for your trading style, can be challenging. In this article, we will explore the various options for fine-tuning your Keltner Channels to achieve maximum performance and accuracy.
We will also discuss the top-performing Keltner Channel values and how to customize your Keltner Channel parameters for optimal results. Whether you are a beginner or an experienced trader, this article will provide valuable insights on how to adjust your Keltner Channel settings for optimal performance. Keltner Channels is a price channel that is used by traders to find overbought/oversold conditions. Investors and traders also use Keltner Channels to spot breakouts that could be the start of a new trend.
Keltner Channels use an exponential moving average to form the middle band, and then plots one upper and one lower band. The distance of the upper and lower bands to the middle band is determined by a multiple of Average True Range.
The most common settings of the Keltner Channels are 20 for the exponential moving average, 10 for the Average True range lookback and 2-3 for the ATR Multiplier.

History
The first version of the Keltner Channels was introduced in the 1960 book “How to Make Money in Commodities” by Chester Keltner. In that book he presented the “Ten-Day Moving Average Trading Rule” which was the following:
Take a 10-day simple moving average (SMA) of the typical price, which is the average of the High, the low and the Close price.
Add and subtract the 10-day SMA of the High-Low, which basically becomes a range calculation, to form the upper and lower channel lines.
In the 1980s, Linda Raschke introduced an updated version of the Keltner Channels. The new version, just like the Bollinger bands used a volatility based measure (ATR) to calculate the channel width.
How Do Keltner Channels Work?
The general idea behind price channels is to identify a channel where the security is most likely to trade. Many price channels, like the Keltner Bands and Bollinger Bands, use a moving average to form the base of the price channel. However, there are other methods of calculating the centerline. Some Price channels use the x-period high and low to set the upper and lower band, which for example is the case with the Donchian Channel.
Since Keltner Channels and other price channels strive to cover most of the price movements, a security trading above or below one of the channels indicates that the security has overextended itself in a short period of time. Or in other terminology, that it is overbought or oversold.
The Keltner Channels will always adapt to the current direction of the security and the current volatility level. However, it is lagging which means that a very quick or overextended move tends to result in the security breaking one of the lines.
Here you can read more about Keltner Bands and Keltner Bands Trading Strategy.
Interpreting Extreme Readings
What a market will do once it is in overbought or oversold territory varies. Some markets have an inherent tendency to revert to the mean, while others are more of the trending sort. Therefore, signals issued from a breach of one of the Keltner bands could mean different things depending on what market and timeframe you trade
For example, a mean reversion trading strategy with Keltner Channels would work very well on stocks on a daily timeframe. However, if you changed the timeframe to 5 minutes, the chances are that that very strategy would fall apart.
The very same thing applies to different markets as well. For example, the energy markets tend to be trend following. If you were to apply a mean reversion with Keltner Channels on such a market, that probably not work too well. Instead, you might want to act on a breakout from the Keltner Channel, since that resonates better with the character of that market.
Calculation
Here is how you calculate Keltner Channels:
The Middle Line is the 20-day EMA
The Upper band is the 20-day EMA + (2 x ATR(10))
The lower Band is the 20-day EMA – (2 x ATR(10))
How To Use Keltner Channels
You can use Keltner Channels in a variety of ways, and below we have chosen to list the most common approaches.
In Mean Reversion
As briefly stated above, Keltner Channels could work very well in a mean reversion strategy. Mean reversion is the tendency of some markets to revert once they has moved excessively, often too quickly in one direction. Below you see an example of a mean reversion trade:
As you can see, the market overextended itself by entering oversold territory and reverted back to its mean shortly thereafter.

With Keltner channels and price channels in general, we can define overbought territory as the upper band, and oversold territory as the lower band.

One of the most common applications of Keltner Channels in mean reversion is to buy once the market closes under the lower band.
The close under the lower band signals that the market is oversold and is about to revert soon.
However, you might want to include some more filters to ensure that the market is actually about to revert. There are many cases, like in the image below, when the market has moved towards the lower band and then continues down.

While failed trades will be the reality of any trading strategy, you probably want to prevent as many false signals as possible.
In most cases, you do this best by adding more filters. The RSI indicator, for example, is widely used to identify oversold and overbought conditions. If used together with Keltner Bands, it could help with filtering out bad trades by waiting for the RSI to show oversold readings.
You may also want to take the market phase into consideration. A falling market will typically have deeper dips before it turns around than a rising market.
One of the most common ways of determining the long term trend of the market is to use the 200-day moving average. If the close is higher than the moving average, you are in a rising market, and vice versa.
In Trend Following
Trend following could be said to be the opposite of mean reversion. Still, Keltner channels work with trend following strategies as well.
With a trend following strategy, the upper and lower bands of the Keltner Channels basically work as breakout levels. If the market closes above the upper Keltner band, that could be a signal that the market has started a more significant upward phase. Conversely, the market breaking the lower band could indicate that a longer period of downward movement is right around the corner.
Below you see how the penetration of the lower Keltner Band preceded a large swing to the downside.

With breakouts from the lower or upper band of the Keltner Channel, you face the same problem as with mean reversion, namely, false trading signals.
There are many ways to limit the number of false breakouts. However, there is no one-fits-all solution.
Different markets have their own quirks and peculiar tendencies that traders can use to increase their odds of only acting on true breakouts. Still, one of the most effective ways to not act on false breakouts, is to only trade trend following strategies in markets that are trending in nature, such as energies or metals.
As a Filter for Other Trading Strategies
One creative way of using the Keltner Channel is as a filter in a trading strategy. You could try to divide the market into several territories, based on the relation of price to the Keltner Bands. Here is an example of how you could define different sections:
- Price is below the lower Keltner Band
- Price is above the lower band, and below the moving average of the Keltner Channel
- The market is between the moving average and the upper Keltner band
- The fourth and last section is above the upper band.
The four sections are visible in the image below:

What we can expect is that the behavior of the market will vary depending on if it is in section one, two or three. In that case, we could use that knowledge to filter out bad trades by only trading in the sections of the Keltner Channel where the strategy performed the best.
Keep in mind that this only is an example of how you could come up with your own twists to common concepts. Try to experiment and you might soon come across something that nearly nobody else has found!
The Best Settings for Keltner Channels
One of the most common questions new traders ask is what settings are the best for one particular indicator. The truth is that there is no definitive answer and that the best settings vary with market, timeframe, and strategy. However, there is some general advice that could help you to determine how to set up the Keltner Channels. Let’s get to it!
How Do You Pick the Keltner Channel Multiplier?
The multiplier is what determines the distance of the upper and lower Keltner Band to the moving average. By changing the multiplier you change the width of the Keltner Channel and so the number of times the market closes above or below one of the Keltner bands.
The most appropriate Keltner Channel multiplier usually is somewhere between 2-3. However, as with everything, it varies with the marked that is tested, as well as with the strategy.
In order to know what multiplier you should use, you could do the following:
- Load the Keltner Channel onto a chart
- Visually determine the multiplier
Let’s try to visually determine the multiplier to make it clear what we mean.
Below I have loaded a chart with the multiplier set to 1.

As you might have noticed, most of the price action is not confined within the lower and upper band. When using the Keltner Channel to detect oversold and overbought conditions, or breakouts for that matter, this does not work at all. Right now we are getting false signals all the time.
In other words, we need to increase the multiplier.
Let’s try it with 1.5.

Most of the price action is still not confined within the upper and the lower band.
Let’s try to increase the multiplier to 2.

Now we see that most of the price action is confined within the upper and lower Keltner Bands. This is what we like to see!
Just remember that increasing the multiplier will results in fewer signals, albeit more accurate ones.
How to Pick The Lenght of the Middle band.
The length of the Keltner Channel is determined by the length of the exponential moving average. The default setting is 20, but you may try to experiment with shorter or longer lengths.
You will find that some markets work well with the standard settings, while others do not. The key to finding out what settings are, best is to experiment in a backtesting software. Just be sure to not go overboard with the tweaking of the parameters. Then you run the risk of creating a curve fit trading strategy.
Best Keltner Channel Settings for Intraday
The same answer as above applies also to intraday trading. However, there is one thing that you should consider when picking the best Keltner Channel settings for intraday trading.
Intraday trading tends to be very volatile compared to trading on daily bars. With lower timeframes, market noise increases as well. These two factors combined mean that you probably should consider increasing the Keltner Channel ATR multiplier, to reduce the number of false signals.
Do Keltner Channels Work?
This is a question that traders use to ask about most indicators and strategies, so why not put the Keltner Channel to the test? Below we will backtest the following conditions on the S&P 500 futures market:
If the close is lower than the lower Keltner band, then buy the next day.
If the close is higher than the upper Keltner band then sell the next day on open.
Set the stop loss to $3000
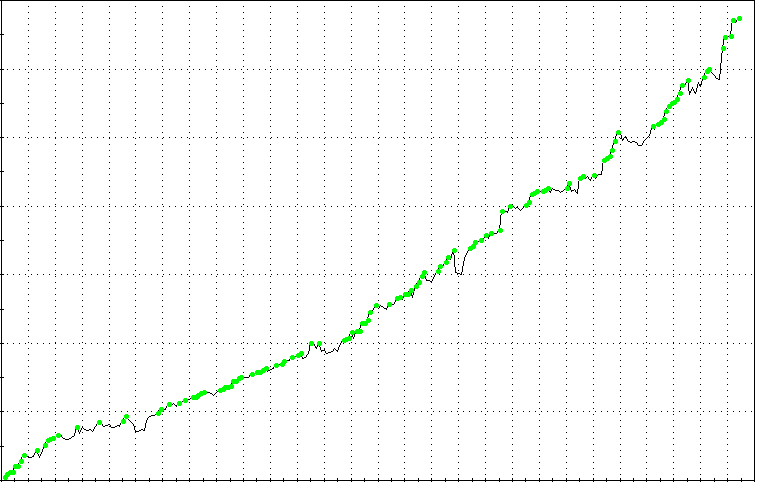
As you might understand from the conditions above, this is a mean reversion strategy. Below you see the results of the test that is made on 15 years of data:

Mean reversion tends to work well on the equity index markets. But what about trend following? Let’s define our next test like this:
If the close is higher than the higher Keltner band, then buy the next day.
Sell one day later
Set the stop loss to $3000

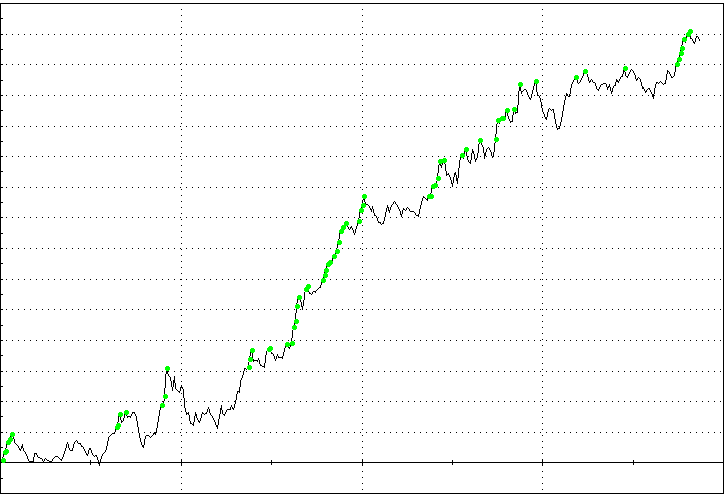
The results of the breakout approach are not as promising. However, if we extend the holding period to five days, we get something that looks better:

However, we should be aware that the last test brings in a lot of the bullish bias of the stock market because of the longer holding period.
Keltner Channels Vs Bollinger Bands
You could say that there are two differences between Bollinger Bands and Keltner Channels.
- The Keltner Channel is smoother than Bollinger Bands
- Keltner Channels use an exponential moving average, whereas Bollinger Bands use a Simple Moving Average.
The Keltner Channel Is Smoother Than Bollinger Bands
Kelner Channels is smoother than Bollinger Bands because the former uses an ATR calculation for the width of the price channel, whereas Bollinger Bands use standard deviation. The smoother line is the reason why many consider Keltner Channels better suited for trend following strategies.
In the image below we can see the difference in smoothness between the two:

Exponential Moving Average vs Simple Moving Average
Keltner Channels use an Exponential moving average while Bollinger Bands use a Simple Moving average. What this means, is that if you compare a Bollinger Band with a Keltner Channel with of the same length, the latter will be more responsive.
This is also visible in the previous image.
Key Takeaways
- Keltner Channels work both for mean reversion and trend following.
- The default settings are 20 for the moving average, 10 for the ATR lookback period, and 2-3 for the ATR multiplier.
- The Keltner Channel is smoother and more responsive than Bollinger Bands
FAQ
What are Keltner Channels, and how do they work in technical analysis?
Answer: Keltner Channels are a technical analysis tool used to identify price channels where a security is likely to trade. They are based on a moving average and adapt to the current direction and volatility of the security. When a security trades above or below these channels, it suggests it has overextended itself, indicating overbought or oversold conditions.
What is mean reversion, and how does it apply to Keltner Channels?
Answer: Mean reversion is the tendency of some markets to revert to their mean after moving excessively in one direction. With Keltner Channels, traders can implement mean reversion strategies by buying when the market closes under the lower band, indicating oversold conditions and an impending reversion to the mean.
How do traders interpret extreme readings from breaches of Keltner Bands?
Answer: Interpretation of extreme readings depends on the market and timeframe. In mean reversion, a breach of the lower band may signal an oversold condition, while in trend-following strategies, a breach of the upper band could indicate a significant upward phase. It’s essential to consider the inherent tendencies of the specific market and timeframe.