Last Updated on 10 February, 2024 by Trading System
As a trader, there are many different types of market tendencies you are looking to profit from. On a fundamental level, you are looking to take advantage of the most basic tendencies of markets, such as trend following, breakouts, and mean reversion.
In this process, we often make use of trading indicators to help us define and quantify the market’s behavior in a consistent and reliable manner. By using a trading indicator, you’re no longer at the whim of your own ability to watch and assess the market behavior but are provided with an objective measure of the movements of the market. Of course, you need to form a trading strategy based on these signals, but it’s not incorrect to say that they help a lot with removing biases from your trading!
In this article, we are going to look closer at the ten best trend following indicators that can be used to either assess the strength of the trend, as well as its direction.
As you’ll see, some of these trend following indicators are really common and well-known, while others are less popular. However, they all have their uses, and definitely can be turned into profitable strategies with the right techniques!
Let’s start with the perhaps most common trend following indicator of them all, namely the moving average indicator.
1. Moving Averages

The moving average is perhaps the most well-known trading indicator there is in trading. Being so simple, it was one of the first technical indicators that were used by technicians before the advent of computerized trading platforms. Being no more than a simple average, it was relatively easy to calculate and draw on a physical chart.
The most common trading approach involving moving averages is to assume that the trend is positive if the average has a positive slope, and the price trades above it, with the opposite conditions applying for a negative trend. When using moving averages to determine the direction of the trend, it’s often done long term, using the 200-period moving average.
You may also use two moving averages in conjunction to create a cross over signals. One of the most well-known examples involves a crossover by the 50-period moving average over the 200-period moving average, which is called a golden cross.

Moving Average Types
In addition to the simple moving average, there are many more types that have taken the concept to the next level. Some of these, like the volume-weighted moving average, look at volume to determine what weight should be given to every historical closing price. Other types of moving averages instead give each datapoint a different weighting depending on how far back it is. The exponential moving average is a great example of this.
All in all, the moving average is a classical trading indicator that has stood the test of time, and remains highly relevant to this date!
2. Moving Average Convergence Divergence (MACD)

MACD, which stands for Moving Average Convergence Divergence, is a trading indicator that attempts to capture the momentum of a market. To do this, it turns two exponential moving averages into a momentum oscillator. To be more exact, the shorter average is subtracted from the longer average, and the value you get is then used to assess the short term trend strength relative to the long term trend.
To make the indicator easier to understand, we’ll briefly look at the four different parts of the MACD Indicator
1. The MACD Line
The MACD line is the most important part of the indicator, and is the difference between the shorter and longer period exponential moving averages. The standard settings for the averages usually are 26 for the longer average, and 12 for the shorter average.
To understand how the market’s movements would impact the MACD line, you may picture a violent burst of upward movement. The result would be that the short term average rises sharply, while the longer period average doesn’t respond as clearly. As such, the difference between the two would increase, and the MACD line would rise.
2. Signal Line
The signal line is used together with the MACD line to provide reversal signals, which appear when the MACD line crosses over the signal line. The signal line simply is an exponential moving average of the MACD line itself. In other words, you could say that it’s a lagging MACD line.
The default setting for the exponential moving average that’s used as the signal line is 9.
3. Histogram
To make it easier to see the difference between the signal line and MACD line, a histogram is added which shows the difference between the two.
4. The Base Line (Zero Line)
The baseline, which also is called the zero-line, is a line that’s drawn where the MACD line goes from negative to positive readings. The image below shows how the histogram turns green as the MACD line crosses the zero line.

In general, the market is thought to be in a bullish state if the MACD line is above zero, and in a bearish state if it’s below zero.
Our complete guide to MACD deals with this indicator in greater depth!
3. On Balance Volume (OBV)
On Balance Volume is a momentum indicator that makes use of volume to get a sense of where the market is headed. Since its first appearance in 1963, it has gained quite some popularity among trend followers and others.
In short, OBV gives you an image of whether the volume is flowing in or out of the security, which can help to establish whether the current trend is worth following or not.
Here is how the indicator is calculated. We recommend that you have a look, since understanding the formula behind the indicator will help a lot with understanding how OBV actually works:
OBV Calculation
The OBV is calculated cumulatively and takes into account both negative and positive volume. Depending on whether the market closes higher, lower, or at the same level, there can be three different outcomes as to the OBV formula itself.
If the close of this bar is higher than the close of the previous bar, then:
OBV= OBV of the previous bar + volume of the current bar
If the close of this bar is lower than the close of the previous bar, then:
OBV=OBV of the previous bar + volume of the current bar
If today’s close is the same as the close of the previous day, then:
Current OBV Reading = Previous OBV
OBV Interpretation and Uses
Due to the formula of the indicator, an advancing OBV line shows that volume is higher on positive days than on negative days. As such, an advancing OBV line is a positive signal, and should, in theory, be an indication that the current market trend is strong, and worth following.
Conversely, a strong bearish trend should be accompanied by a declining OBV line, which suggests that bears are in control at the moment.
If the market diverges from the direction of the OBV line, it’s a sign that the current trend might not be that strong, and could revert anytime soon.
4. Relative Strength Index (RSI)

The relative Strength Index is one of our absolute favorite trading indicators, and can be used in anything from trend trading to mean reversion trading.
RSI is calculated by comparing the strength of recent up-moves, to the strength of the recent negative move. It then outputs readings between 0-100, with readings above 70 and below 30 being considered as extremes.
One of the most popular approaches using this indicator is to buy once the RSI goes below a certain threshold value, in anticipation of the coming market reversal. However, that’s not why the RSI has made it on this list.
In addition to being a potent mean reversion indicator, it also serves incredibly well in identifying when the current trend is strong, and perhaps worth riding. In those cases, high readings are seen as a positive sign for trend following, rather than an ominous sign of an impending negative price move.
If you want to read more about the RSI and its various applications, you can do so in our complete guide to the RSI indicator.
5. Donchian Channel

The Donchian Channel Indicator is a trading indicator that was invented by Richard Donchian in the middle of the 20th century. As you might have guessed, its main function is to define the trending traits of the markets, and signal when it’s time to enter in the direction of the prevailing trend.
The indicator itself is very simple, and consists of a lower and an upper band, which are made up of the 20-bar high, and the 20-bar low.
As soon as the market breaks out above the upper band, or below the lower band, it’s interpreted as a signal to enter a position in the direction of the breakout.
However, of course, this is just the basic setup, and to turn it into a working trading strategy, you’ll have to add more filters and conditions to get rid of a lot of false signals for trend following.
If you want to read more about the Donchian channel indicator, you may want to have a look at our complete guide to Donchian channels!
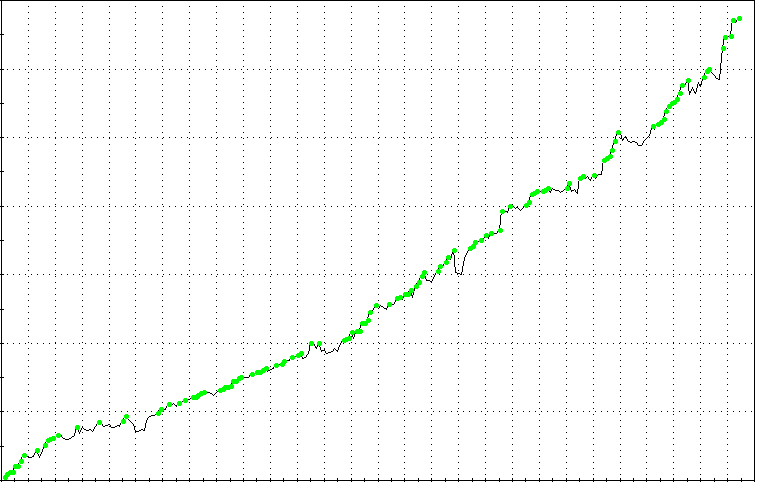
7. Parabolic SAR

Parabolic SAR is a trading indicator that is used mainly to gauge the direction of the price, in order to identify those times when a trend is worth entering. As a matter of fact, its inventor, J.Welles Wilder, is also the inventor of the quite well-known Relative Strength Index, which we have already covered in this article.
The parabolic SAR is a little different from many indicators when it comes to how it appears on the chart. While other indicators often have a line that appears on or below the chart, the Parabolic SAR uses a series of dots that are placed below or above the price. As a general rule of thumb, dots placed below the price are considered a bullish signal, while dots above the price are considered a bearish signal.
In other words, when the dots change position, it shows us that we might have seen the start of a change in the direction of the trend. In the image above you see how the position of the Parabolic SAR changes as the prices turn around.
8. Aroon

Aroon was developed by Tushar Change in 1995, and is an indicator that attempts to determine not only when a stock is trending, but also how strong the trend is. An interesting tool for trend following in other words.
An interesting fact is that “Aroon” means “Dawn’s Early Light” in Sanskrit. According to Tushar Chande, he chose this name since the indicator was made to identify the beginning of a new trend.
So how does it work?
Well, Aroon consists of two separate parts, which are “Aron-Up”, and “Aroon-Down”.
Aroon-up measures the number of bars since the last 25-bar high, while Aroon down measures the number of bars since the last 25-bar low.
While the logic might seem similar to what’s used in other momentum indicators, such as stochastics, Aroon remains special because it not only takes into account the actual position of the close relative to the previous highs and lows, but also the time that has passed.
Interpretation
When interpreting the indicator, you generally say that there are three stages to an emerging signal:
- The first stage is when Aroon Up is above Aroon down. Bearing the original definition of the indicator in mind, this shows us that highs have been more recent than lows.
- In the second stage, the Aroon-up line should move up above 50, while the Aroon-down line should move below 50.
- The final stage occurs when Arron-up goes up to 100, indicating that a new high has been made, while Arron-down remains on very low levels.
9. ADX

ADX, which stands for Average Directional Index, is an indicator that measures the strength of a trend, regardless of its direction. Readings below 20 usually indicate that the trend is strong, while reading above 25 signals that we are dealing with a strong trend that could have quite some distance left to cover.
ADX is one of our absolute favorite trading indicators and works really well on a lot of markets and trading strategies. Many times, a strategy can be improved substantially by just adding an ADX filter, and choosing to take trades in only high or low volatility conditions.
The default setting is 14 periods, but we have found it to work well with a lot of settings that target various indicator lengths. For instance, by using 5-periods you get a chance to gauge the very short term trend strength, whereas a longer setting of perhaps 20 will give you a view of the strength of the longer-term trend. All these can be relevant to a strategy, and what works best depends on the characteristics of the strategy you are working with.
You may read more about ADX in our complete guide to the ADX indicator.
10. Bollinger Bands
Just like the Donchian channel indicator, Bollinger bands fall into the category of price channels. However, while Donchian channels use a very simple method to decide the placement of the two-channel lines, Bollinger bands use a somewhat more complicated method.
The base from which the two lines are calculated, is a simple moving average. This also appears on the chart, in the form of a middle band.
To get the upper and lower bands, you then subtract or add the standard deviation of price moves, times two, from the moving average.
The result is a price channel that adapts its distance to the moving average based on the current volatility level of the market. In other words, as volatility picks up, the bands will be drawn at a longer distance from the average, while they will contract when volatility gets lower.
Uses
Just as with other types of price channels, the most common approach is to simply regard a breach beyond one of the lines as a breakout that might be worth acting on. However, just as with any signal, just taking trades based on this very signal type won’t work well at all. You have to make sure to add appropriate filters and conditions that act to filter out bad trades, and ensure that you’ll end on the winning side!
Final Notes
As you see, there are quite a lot of trend-following trading indicators that can help you to find profitable trade entries and setups. Some make use of really simple principles, while others have adopted more complicated formulas and methods.
While it might seem obvious that the latter category should be the better choice, that’s far from true! As a trend trader, you should strive to keep your strategies and methods as simple as possible, to avoid curve fitting. In addition, it’s often the most simple methods that tend to work well
Knowing all of these trend following indicators is a great start, but it won’t take you very far trading wise. In order to become a profitable trader you need to take the indicator concepts and tweak them, so that they fit your market, timeframe, and trading style. This is something we cover in much more depth in our article on how to build a trading strategy. Make sure to check it out!
FAQ
How does the Moving Average indicator work, and what are its different types?
Trend-following indicators help traders identify and follow the prevailing direction of market trends. The Moving Average indicator smoothens price data to identify trends. Common types include simple moving averages (SMA), exponential moving averages (EMA), and volume-weighted moving averages. A Golden Cross occurs when a short-term moving average crosses above a long-term moving average, signaling a potential bullish trend.
How does the On Balance Volume (OBV) indicator use volume to analyze market trends?
OBV calculates cumulative volume, considering positive and negative volume based on price movements. Rising OBV suggests a bullish trend, while falling OBV indicates a bearish trend.
How does the Donchian Channel help traders identify trends and signal entries?
The Donchian Channel uses upper and lower bands based on historical highs and lows. Breakouts above or below these bands can signal potential trend reversals or continuations.