Last Updated on 10 February, 2024 by Trading System
The Trin Index indicator is a powerful tool used in technical analysis to identify trends and make sound investment decisions. Developed by Richard W. Arms in 1967, the Trin Index is a market breadth indicator that compares the advance–decline ratio to the advance–decline volume ratio, using data from the NYSE or Nasdaq. By dividing the Advance–Decline Ratio by the Advance–Decline Volume Ratio, the Trin Index provides a comprehensive way to assess market breadth. It can also be calculated using breadth statistics from other indices, such as the S&P 500 or Nasdaq 100. In this article, we will explore the Trin Index indicator and discuss how investors can use it to gain a better understanding of the market.
In this post, we will discuss what you need to learn about TRIN, including:
- What TRIN is
- Its formula and how it is calculated
- How to interpret the values
- Examples of how the TRIN Index is used in trading
- The difference between the Arms Index (TRIN) and Tick Index (TICK)
- Limitations of the TRIN
The indicator is used for measuring the relationship between market supply and demand, so it can successfully be used to estimate market sentiment. TRIN acts as an oscillator, and it is often used to identify short-term overbought and oversold situations in the overall market. Sometimes, a moving average may also be applied to smooth the data series.
What is the TRIN Index?
The TRIN Index, also known as the Arms Index or simply the TRIN, is a shortened form for “Trading INdex”, which is a short-term breadth indicator for gauging the market sentiments. It compares the number of advancing and declining stocks (AD Ratio) to advancing and declining volume (AD volume). Invented in 1967 by Richard W. Arms, Jr., the index is used to estimate the overall market sentiment, as it measures the relationship between market supply and demand.
To most financial analysts, the TRIN Index serves as a predictor of future price movements in the market, especially on a day-to-day basis because it generates short-term overbought and oversold conditions, which shows when the stock market is about to change direction. It is functionally an oscillator-type indicator that swings between overbought or oversold levels, indicating the conditions of the market. The indicator does this by comparing advancing versus declining stocks with advancing versus declining volume.
The Arms index is considered a breadth indicator because it gives an indication of how widely spread, in terms of advances versus declines, the stock market movement is, as seen in any of the major stock market indexes, such as the S&P 500 Index or the NASDAQ 100 Index. The TRIN Index is believed to indicate both the price velocity (advances/declines) and weight (advancing/declining volume figures) of the stock market’s overall price movement since it factors in both price advances or declines and volume data.
Basically, if the AD Volume generates a higher ratio than the AD Ratio, the TRIN will be less than one, but if the AD Volume has a lower ratio than the AD Ratio, the TRIN will be greater than one. Typically, a TRIN reading below one occurs in a strong price advance, since the huge volume in the rising stocks helps fuel the rally. Conversely, a TRIN reading above one occurs when there is a strong price decline, as the huge volume in the decliners helps fuel the selloff. In essence, the Arms Index is inversely related to the movement of the broad market index — a strong price rally will see the TRIN move to lower levels, while a falling market index will be accompanied by a rising TRIN.
Calculating the TRIN Index: the formula and the calculation
The formula for calculating the TRIN Index consists of the following factors:
- Advancing Stock: The number of stock issues that have increased in price compared to the previous day’s price
- Declining Stock: The number of stock issues that have decreased in price compared to the previous day’s price
- Advancing Volume: The total volume of all stocks that have advanced
- Declining Volume: The total volume of all stocks that have declined
The formula
The formula for the TRIN index is given as follows:
TRIN = [Advancing Stocks/Declining Stocks] / {Advancing Volume/Declining Volume}
As you can see, a key component of the TRIN Index is the Advance-Decline (AD) Ratio, which is the number of advancing stocks divided by the number of declining stocks.
The calculation
The TRIN indicator is automatically calculated and provided by various charting applications, but it can also be calculated by hand. To manually calculate the TRIN Index, you may use the following steps:
- Calculate the AD Ratio by dividing the number of advancing stocks by the number of declining stocks — you may do this at set intervals, such as every 30 minutes, each day, or any interval of choice.
- Calculate the AD Volume by dividing the total advancing volume by the total declining volume.
- Divide the AD Ratio by AD Volume.
- Record the result and plot the values on a graph.
- Repeat the process at the next chosen time interval.
- Connect multiple data points to form a graph to see how the TRIN moves over time.
For example, let’s assume that on a given day the number of advancing stocks was 2,300 and the number of declining stocks was 739. In this case, the advance/decline ratio would be 3.11. At the same time, assuming the total volume of the advancing stocks was 1,200 and the total volume of declining stocks was 140, the advance/decline volume ratio would be 8.57. So, the TRIN would be calculated as 3.11/8.57 = 0.36. Then, you repeat it for the next interval and continue like that.
How to interpret the TRIN values
The TRIN indicator aims at providing a more dynamic explanation of overall market movements in the composite index of stock exchanges, such as the NYSE composite index or the NASDAQ composite, by analyzing both the breadth and strength of the movements. However, using the indicator is a bit tricky because it has an inverse relationship with the market action.
At an TRIN Index value of 1.0, the ratio of AD Volume is equal to the AD Ratio, so the market is said to be in a neutral state. What this means is that the up volume is evenly distributed over the advancing issues and the down volume is evenly distributed over the declining issues. Since the TRIN indicator is inversely related to the market movement, rising values above 1.0 indicate increased selling pressure and market decline — there’s a greater volume in the average down stocks than the average up stocks. On the other hand, values below 1.0, and falling, indicate increased buying pressures and a bullish market, since there’s a greater volume in the average up stocks than the average down stocks.
However, this relationship is up to the points adjudged as oversold and overbought levels. But to successfully use the TRIN levels to indicate temporary overbought or oversold conditions in a market can be a bit tricky. For most analysts, TRIN values below 0.50 are considered overbought levels, so at such levels, they anticipate a possible downward correction or even a full market reversal. On the other hand, TRIN values greater than 3.00 are usually interpreted as oversold levels, which may indicate a potential market reversal to the upside.
Trin Ratio – Bullish or bearish?
As you can see there’s a wide range of TRIN values between overbought values below 0.50 and oversold values above 3.00. When the TRIN Index is above 1.0 and rising, it is interpreted as a bearish signal up until it gets above the 3.00 value, at which level the chances of a bullish reversal is high. On the flip side, when the index is below 1.0 and falling, it is interpreted as a bullish signal until it falls below the 0.5 level, at which level it gives a potential bearish reversal signal.
To make the TRIN more useful, many analysts don’t just look at the basic TRIN values but also note how the TRIN value changes throughout a trading day or over a specific period under review. This helps them to more precisely pinpoint what constitutes extreme levels in the TRIN on each side in the current market conditions. For instance, it could be that the market is in a condition where TRIN values fall no lower than 0.75 and rise no higher than 2.25. In this case, some analysts and traders may use the 0.75 and 2.25 levels as the overbought and oversold levels respectively for that market during that specific period.
While most traders and market analysts look for extremes in the index value for signs that the market may soon change directions, some focus on the TRIN’s equilibrium value of 1.00 and consider any readings below 1.00 as potential indications of overbought conditions, and any readings above 1.00 as potential indications of oversold conditions.
The importance of the TRIN
The TRIN is a very important indicator in the equity market. In fact, the TRIN Index is displayed on the central wall of the New York Stock Exchange, with its value continuously reading throughout the trading hours. As an important market index, the TRIN distinguishes itself from other indices by putting into consideration the volume of stocks. Hence, it is one of the most commonly used indices in financial analysis; companies provide a more thorough technical analysis of the general stock market sentiment.
While using the TRIN Index to assess the broad market sentiment, it is important to note that the farther away from 1.00 the TRIN reading is, the larger the contrast between the buying and selling of stocks. A value that exceeds 3.00 typically indicates an oversold market and that bearish sentiment is too dramatic, which could mean an upward reversal in the broad market index is around the corner. Conversely, a TRIN reading below 0.5 might mean that the market is overbought and the bullish sentiment is overheating — an indication that there might be a downward reversal in stock prices in the near future.
To get a better understanding of the market condition, it is important to refer to several indices instead of using only one. For the TRIN, not only is it important to examine the readings carefully but also necessary to monitor the rate of change during the day to see if the market may change directions in the future. As an oscillator, the index provides real-time information on the TRIN, thereby enabling the users to know when the conditions are right to buy or sell the stocks. By separating the stocks into advancing and declining ones, the TRIN Index is easy to read and understand, and its incorporation of stock volume makes it especially important to users as it shows the strength behind the moves.
Examples of how the TRIN Index is used in trading
Stock market analysts often use the TRIN indicator to identify market conditions under which the short-term market trend may be about to change from bearish to bullish sentiment — if the market is temporarily oversold — or from bullish to bearish sentiment (if the market is considered overbought). Additionally, traders may use the trend to identify potentially profitable buying or selling price levels. Now, let’s take a look at some chart examples:
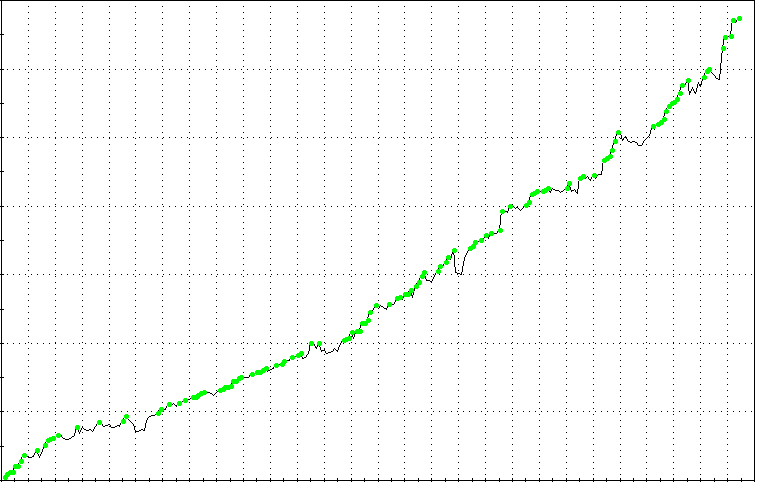
The chart above is that of Apple (NYSE: AAPL): it shows the TRIN with the upper boundary (oversold level) set at 2.25 and the lower boundary (overbought level) set at 0.50. Traders who bought into the market when the TRIN climbed above 2.25 (entered the oversold region), as indicated by the green vertical dotted line and the green up arrow, would have ridden the upswing that followed.

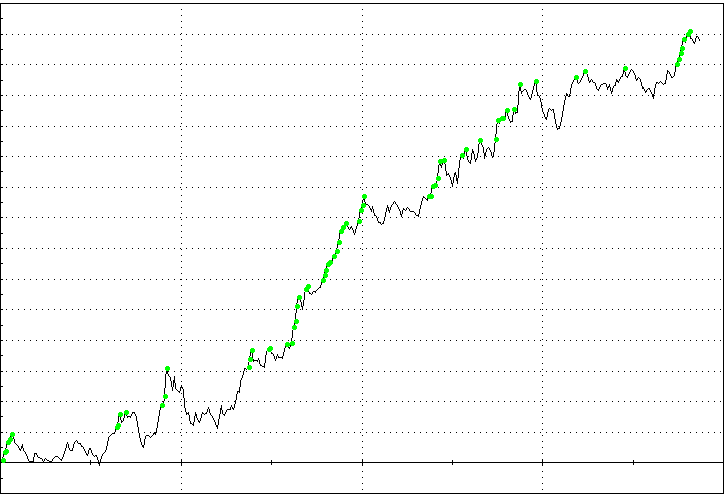
In the chart below, the pink vertical dotted line shows when the TRIN fell below the 0.50 level, which indicates overbought conditions. A trader who went short on the stock at that period would have made some profits riding down the downward price swing that followed.

One good thing about the TRIN is that it is a leading indicator — that is, it signals a potential market reversal before it happens. Looking at the above charts, you can easily see that the TRIN tends to predict the actual turn in the stock market direction a few days before the reversal comes into effect. Although the TRIN may help a trader to “sell the top” or “buy the bottom”, it is necessary to look for confirming price action and other hints in the broad market index before making a final decision.
When the TRIN values are relatively steady and around the 1.00 level, which is seen as a market in equilibrium, it may be better to stand aside and wait for further market action before taking any trading decision. Most often than not, market actions that occur without moving the TRIN indicator significantly in one direction or the other are more likely to prove irrelevant for the trading day.
Limitations of the TRIN
Despite all the advantages of the TRIN indicator, it also has drawbacks due to some errors in the way it is computed, which might give false readings. As you know, the TRIN Index emphasizes volume, so inaccuracies may arise when there isn’t as much advancing volume in advancing issues as expected. While they may not occur often, they could potentially make the indicator unreliable. Traders and investors need to be aware of those mathematical peculiarities and ensure that they use the indicator in conjunction with other indices to get cohesive results.
Now, let’s take a look at some examples of instances where problems may occur:
- A very bullish day may occur with twice as many advancing issues as declining issues and twice as much advancing volume as declining volume. In this situation, despite the very bullish trading, the TRIN would yield only a neutral value of 1.0 {(2/1)/(2/1) = 1.0}. So, the index’s reading may not be entirely accurate.
- There may be a highly bullish day scenario where there are three times as many advancing issues as declining issues and twice as much advancing volume as declining volume. In this case, despite the bullishness of the market on that day, the TRIN would yield a bearish value {(3/1)/(2/1) = 1.5}, which implies an inaccuracy.
- One other drawback of the Arms Index is that its value can fluctuate significantly either intraday or from one trading day to the next, even though the overall market conditions would not usually be described as volatile. So, in the graph, you would see the indicator line often swinging from one end to the other. To reduce the swinging and smoothen some of the inherent volatility in the TRIN indicator, some market analysts and traders tend to use a 10-day moving average of the TRIN value.
One way to solve the AD Volume and AD Ratio problem would be to separate the two components of the Arms Index instead of using them in the same equation. That is, the A/D Ratio (advancing stocks divided by declining stocks) could show one trend, while AD Volume (advancing volume divided by declining volume) could show a separate trend. Both of these could be compared to tell the market’s true story. Note that the AD Ratio is the advance/decline ratio, while the AD Volume is called the upside/downside ratio.
The difference between the TRIN and the Tick Index (TICK)
While the TRIN compares the number of advancing and declining stocks to the volume in both advancing and declining stocks, the Tick index compares the number of stocks making an uptick to the number of stocks making a downtick. So, the Tick Index does not factor volume. However, both are used to gauge intraday sentiment, and extreme readings can signal potentially overbought or oversold conditions.
FAQ
Question 1: What is the long-term outlook for the TRIN Index Indicator?
Answer: The long-term outlook for the TRIN Index Indicator is that it is a reliable and useful indicator for stock market analysis over the long-term.
Question 2: What is the purpose of the TRIN Index Indicator?
Answer: The purpose of the TRIN Index Indicator is to measure the relative strength of the stock market by comparing the number of advancing stocks to the number of declining stocks on any given day.
Question 3: How is the TRIN Index Indicator calculated?
Answer: The TRIN Index Indicator is calculated by dividing the number of advancing stocks by the number of declining stocks and then multiplying the result by the index’s average value.
Question 4: How is the TRIN Index Indicator used in stock market analysis?
Answer: The TRIN Index Indicator is used in stock market analysis to measure the relative strength of the stock market and identify potential trends.
Question 5: What is the history of the TRIN Index Indicator?
Answer: The TRIN Index Indicator was developed by Richard Arms in the 1970s as a tool to measure the relative strength of the stock market.
Question 6: What are the advantages of using the TRIN Index Indicator?
Answer: The advantages of using the TRIN Index Indicator include being able to quickly and accurately measure the relative strength of the stock market, identify potential trends, and make informed decisions.
Question 7: What are the limitations of the TRIN Index Indicator?
Answer: The limitations of the TRIN Index Indicator include the fact that it is a short-term measure of the stock market and does not take into account long-term trends or macroeconomic factors.
Question 8: What are the potential uses of the TRIN Index Indicator?
Answer: The potential uses of the TRIN Index Indicator include identifying short-term trends, making investment decisions, and assessing the overall strength of the stock market.
Question 9: How does the TRIN Index Indicator compare to other stock market indicators?
Answer: The TRIN Index Indicator is a reliable and useful tool for stock market analysis, but it should be used in conjunction with other indicators such as the Dow Jones Industrial Average and the S&P 500.
Question 10: How does the TRIN Index Indicator help investors make decisions?
Answer: The TRIN Index Indicator helps investors make decisions by providing a quick and accurate measure of the relative strength of the stock market, allowing them to identify potential trends and make informed decisions.
Question 11: What are the risks associated with using the TRIN Index Indicator?
Answer: The risks associated with using the TRIN Index Indicator include the fact that it is a short-term measure of the stock market and does not take into account long-term trends or macroeconomic factors.
Question 12: How does the TRIN Index Indicator impact the overall market?
Answer: The TRIN Index Indicator impacts the overall market by providing a quick and accurate measure of the relative strength of the stock market, which can help investors make informed decisions.
Question 13: How does the TRIN Index Indicator help traders identify trends?
Answer: The TRIN Index Indicator helps traders identify trends by providing a quick and accurate measure of the relative strength of the stock market, allowing them to make informed decisions.
Question 14: What are the most reliable sources of data for the TRIN Index Indicator?
Answer: The most reliable sources of data for the TRIN Index Indicator are stock market analysis websites such as Yahoo Finance and Bloomberg.
Final words
The TRIN index indicator is a volatile market breadth indicator that can be used to generate overbought and oversold signals. Short-term traders can use the TRIN Index to generate short-term signals or apply a 10-day moving average of the index to generate more medium-term signals. However, it should be combined with other aspects of technical analysis.