Last Updated on 10 February, 2024 by Trading System
Futures trading is an excellent way to make good returns in a short period, and technical indicators can be of great help in earning those good returns.
The best trading indicator for futures trading depends on the type of market condition. However, prudent investors don’t make the mistake of relying on a single tool. As the market goes from one situation to the other, traders have to adapt their tools accordingly. In futures trading, traders generally deal with three types of situations. Those are trending markets, short term oscillations, and support & resistance breaks.
For every strategy and situation, traders will have to asses what trading indicator to use. The Moving Average Convergence Divergence (MACD) is one indicator that works quite well in a trending market. Meanwhile, a Moving Average (MA) works well when the market is breaking support or resistance. Furthermore, RSI is ideal for when the investor wants to capture short-term market oscillation.
So, if you want to know more about how to use indicators when trading futures, then read on!
How to Use Trading Indicators In Varying Market Conditions
To understand the market conditions of a futures market, it is essential to understand the nature of futures. A future is a contract to buy/sell a good at a given price on a future date. These goods are often commodities like oil and corn. Commodity futures are an asset, and once traded, they can be a source of good returns for smart investors.
Traders often look at the different types of movements in the market and then employ strategies to exploit those movements. Futures markets most commonly go through three types of movements:
- Ranging
- Trending
- Breaking ceiling/floor
Movements in the futures markets depend upon the nature of the commodity and introduction of relevant news in the market. Futures contracts tend to be ranging or trending most of the time. However, they react fast to any communication in the market. This often leads to a breakout, that is the market breaking a ceiling/floor.
Furthermore, over the medium and long-term, the market may break its ceiling because of structural changes in the market. An example of a structural change in the market for oil-futures could be depleting global reserves. The length of time for these price movements also depends on the asset. Medium-term for one asset can be long-term for another asset.
Still, it’s important to remember that the market may break a ceiling/floor without any apparent reasons. Market breakouts occur all the time and simply are corollaries of moving markets.
How Do I Use RSI in a Ranging Futures Market?
Under normal conditions, the market tends to oscillate between a specific range. A typical ranging futures markets has the following shape.

During such a market, traders can still make a good return by capturing the oscillation. Capturing the swing requires buying during the start of an upward oscillation and selling the shares once the oscillation has reached its peak. Such a strategy would translate to staying in the market in the highlighted period.

To go long in the highlighted regions, the investor needs to know when the trend will take a turn. The RSI indicator is a good technical indicator for predicting market oscillations in a ranging market.
The reasoning behind this is that the RSI indicator states that the markets tend towards the equilibrium. If the market is overbought, the bearish forces will gain strength and reduce the price of a future with increased selling. Similarly, if an asset is oversold, the market will again return to equilibrium via buying, and the price will increase as a result.
So, the RSI indicator tells the investor whether the market is overbought or oversold. If the RSI indicator value is above 70, the asset is said to be overbought. Similarly, if the asset’s RSI is under 30, the asset is said to be undersold. Prudent investors buy oversold assets, so they can own the asset in the blue shaded area (above image).
Therefore, the RSI indicator is a great tool for making good returns in a ranging market.
Key take away: When the market is stagnant, use the RSI overbought and underbought values to make gains in the market.
How to Use MACD In a Trending Market
Though the RSI indicator is an excellent tool for ranging market, the market does not always stay in such behavior. However, many times, the commodities markets see strong trending movement as a result of new information. To make good returns in such a situation, one could use MACD. MACD captures the trending market by subtracting the 26-period exponential moving average (EMA) from the 12-period EMA.
![]()
For a given price line the MACD is presented in the following image.

MACD helps detect a new trend by integrating short-term (12-periods moving average) and long-term price movement (26-period moving average). A divergence between short-term behavior and long-term behavior shows the creation of a new trend. In the following image, the histogram shows the difference between the MACD line and the signal line.

Therefore, an increase in the histogram might indicate the creation of a new direction.
After the release of new information, traders could choose to start using MACD to look for a bullish divergence. Under a bullish divergence, the MACD line will have lower highs combined with higher lows for the price line. One can see a bullish divergence in the image below

MACD is important for both entering and exiting in a trend. For example, for the above diagram, the investor should consider exiting the market if the histogram starts showing a bearish divergence. In a bearish divergence, the MACD line’s lower highs will be coupled with lower lows on the price line.
Key take away: When the market is integrating new information, use bearish and bullish divergence of the MACD line to spot long-term price reversals.
Using the Moving Average Indicator to Detect Trends
A new trend in futures may start with a breakout. Breakouts sometimes even become the start on a new long term trend. For example, a bullish breakout in bearish market conditions could indicate that the bearish trend now is replaced by a bullish one.
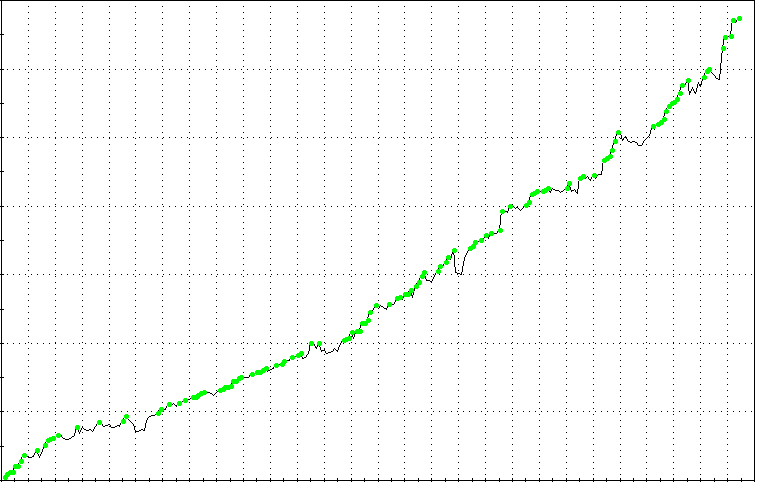
When the price is going through a long-term change, they are said to be in a break-out. In a break-out, the price is breaking ceiling or floors, depending on whether the breakout is bullish or bearish. Below is an example of a bullish breakout.

Notice how the price floor is horizontal in the above image. This is what happens when markets are not trending upwards.
A moving average can act as a solid floor for a market that is trending. The moving average is the average of the last x-periods.

Notice how the floor changes with a rising market. Now let’s imagine you had used a simple support line, drawn from the previous low.

By using a moving average, the support line will adapt to the rising market. If the black line (support level) was assumed to be the price floor, then you would never be able to catch the dip in the market, since it would revert before the black line was touched. As a result, you would have missed out on good returns that could be made from the subsequent rally.
The main advantage of using Moving average is that it allows you to automatically adjust your expectations of resistance points with a change in the market.
Key take away: Use moving average to adjust your expectations about resistance points for price movements dynamically.
Conclusion:
Futures markets are an excellent opportunity for investors looking to earn good returns. However, maximizing profits requires adapting to the movements of the market through the use of technical indicators. However, every indicator is designed to perform in a specific market situation. RSI market is really good at capturing the volatility of the market. MACD is good for capturing a trending market. While Moving average is really good at analyzing structurally changing markets. It is up to the investor to judge the market and use an appropriate measure.
FAQ
Which Technical Indicators Are Best for Futures Trading in Different Market Conditions?
The choice of technical indicators depends on market conditions. For trending markets, the Moving Average Convergence Divergence (MACD) works well, while Moving Averages (MA) are effective for support and resistance breaks. The Relative Strength Index (RSI) is ideal for capturing short-term market oscillations.
How Does the RSI Indicator Help in a Ranging Futures Market?
In a ranging market, where prices oscillate within a specific range, traders can use the RSI indicator to capture market oscillations. The RSI indicates overbought or oversold conditions. Buying oversold assets and selling overbought assets during market oscillations can result in profitable trades.
What Role Does MACD Play in Identifying Trends in Futures Trading?
MACD (Moving Average Convergence Divergence) is effective in identifying trends in futures trading. It subtracts the 26-period Exponential Moving Average (EMA) from the 12-period EMA, helping traders detect new trends. Bullish and bearish divergences in MACD can signal potential long-term price reversals.